Structured Analysis And System Specification
Table of Contents
- 1. Structured Analysis And System Specification
- 1.1. Part 1: Basic Concepts
- 1.1.1. The Meaning of Structured Analysis
- 1.1.2. Conduct of the analysis phase
- 1.1.2.1. The classical project life cycle
- 1.1.2.2. The modern project life cycle
- 1.1.2.3. The effect of Structured Analysis on the life cycle
- 1.1.2.4. Procedures of Structured Analysis
- 1.1.2.5. Characteristics of the Structured Specification
- 1.1.2.6. Political effects of Structured Specification
- 1.1.2.7. Questions and Answers
- 1.1.3. The Tools of Structured Analysis
- 1.2. Part 2: Functional Decomposition
- 1.3. Part 3: Data Dictionary
- 1.4. Part 4: Process Specification
- 1.5. Part 5: System Modeling
- 1.6. Part 6: Structured Analysis for a Future System
- 1.7. User-Analyst relationship
- 1.8. Links to Category Theory
- 1.9. Borrow in Open Library
- 1.10. Backus–Naur form - Wikipedia
- 1.11. https://www.eviltester.com/2017/04/notes-on-structured-analysis-and-system.html
- 1.12. Linearization losses paralellization
- 1.13. What’s missing today
- 1.14. What does it bring to the table
- 1.1. Part 1: Basic Concepts
1. Structured Analysis And System Specification
1.1. Part 1: Basic Concepts
1.1.1. The Meaning of Structured Analysis
1.1.1.1. What is analysis?
Analysis is the study of a problem, prior to taking some action: study some business are or application, usually leading to the specification of a new system. The action to be taken later is the implementation of that system
The most important product of systems analysis is the specification document
Target Document: establishes the goals for the rest of the project and defines what the project will have to deliver in order to be considered a success (a )
- Selecting an optimal target (through Cost-benefit Analysis)
- Producing detailed documentation of that target in such a manner that subsequent implementation can be evaluated to see whether or not the target has been attained
- Producing accurate predictions of the important parameters associated with the target, including costs, benefits, schedules and performance characteristics
- Obtaining concurrence on each of the items above from each of the affected parties
- Analysis, Users and Specification
Software is complicated, people (users) are complex
- No system is going to succeed without the active and willing participation of its users. Users have to
- be made aware of how the system will work
- how they will make use of it
- be sold on the system.
- Their expertise in the business area must be made a key ingredient to the system development
- They must be kept aware of progress, and
- channels must be kept open for them to correct and tune system goals during development
- be made aware of how the system will work
The analyst is the middleman between the user, who decides what has to be done, and the development team, which does it. He bridges this gap with a Target Document
The success of the specification process depends on the product (Target Document) being able to serve as a model of the new system.
- No system is going to succeed without the active and willing participation of its users. Users have to
- Cost-benefit Analysis
The study of cost-benefit of potential systems is the feedback mechanism used by an analyst to select an optimal target
An accurate and meaningful system model helps the user and the analyst perfect their vision of the new system and refine their estimates of its costs and benefits
- Feasibility Analysis
The continual testing process the analyst must go through to be sure that the system he is specifying can be implemented within a set of given constraints.
Is more akin to design than to the other analysis phase activities, since it involves writing tentative physical models of the system and evaluating them for ease of implementation
- Estimating
The analyst is foverver being called upon to estimate cost or duration, resource usage, …
I have never heard of a project’s success being credited to the fine estimates an analyst made; but the converse is frequently true
- Nobody is an expert estimator
- We don’t build our estimating skills, because we don’t collect any data about our past results
- None of this matters as much as it ought to anyway, since most things we call “estimates” are not estimates at all
All these factors aside, estimating plays a key part in analysis. There are some estimating heuristics that are a byproduct of Structured Analysis
- Nobody is an expert estimator
- The Defensive Nature of Analysis
The overriding concern of analysis is not to achieve success, but to avoid failure. Analysis is essentialy a defensive business
1.1.1.2. Problems of analysis
- Communication Problems
- the natural difficulty of the describing procedure
The business specification is, for the most part, involved in describing procedure. Procedure, like dance, resists description (It is far to demonstrate procedure than to describe it) → overcome this difficulty through the use of graphics - the lack of a common language between analyst and user
When you use a picture instead of text to communicate, you switch mental gears. Instead of using one of the brain’s serial processors, you use a parallel processor - the inapropiateness of our method (narrative text)
The things analysts work with are totally inapropiate for most users. The one aspect of the system the user is most comfortable talking about is the set of human procedures that are his interface to the system - the lack of any usable early model for the system
We’re describing usually a system that exists only in our minds: we are inclined to fill in the physical dtails much too early
- the natural difficulty of the describing procedure
- The Changing Nature of Requirements
When we freeze a Target Document, we try to hold off or ignore change, but the document is only an approximation of the true project target.
Therefore, by holding off and ignoring challenge, we art trying to proceed a target without benefit of any feedback
Why managers want to freeze it?
- They want to have a stable target to work toward (understandable)
- An enormous amouynt of effort is invovled in updating a specification (ridiculous)
Is it unnaceptable to write specifications in such a way that they can’t be modified → Ease of modification has to be a requirement of the Target Document
Maintanability of the Target Document is every bit as essential as maintainability of the eventual system
- They want to have a stable target to work toward (understandable)
- The Lack of Tools
Analysts work with their wits plus paper and pencil. You are looking for some tools to work with, but most analysts don’t have any.
You would have little difficult evaluating a piece of code, but evaluating a design is more difficult, and you would be somewhat less sure of your judgement
- Problems of the Target Document
An intelligent way to deal with size is to partition: break it down into component pieces (modules)
- Work Allocation
Our failure to come up with an early partitioning of the subject matter means that we have no way to divide up the rest of the work
- Politics
The underlying cause of political difficulty is usually the changing distribution of power and autonomy that accompationes the introduction of a new system
Political problems aren’t going to go away and they won’t be “solved.” The most we can hope for is to limit the effect of disruption due to politics.
Structured Analysis approaches this objective by making analysis procedures more formal.
Clear tasks ⇒ less expected political impact
1.1.1.3. The user-analyst relationship
- The hands-on user, the operator of the system
- The responsible user, the one who has direct business responsibility for the procedures being automated by the system
- The system owner, usually upper management
The analyst must be responsible for communication wit all of the users
To spare the user the bother of the early system negotiations, and to spare the development team the bother of dealing with users, ofthen some person or organization is appointed “User Representative.”
When it comes to accepctance, they step aside and let the real user come forward, and nobody has been spared any bother
- Division of Responsibility Between Analyst and User
- Logical Considerations: What needs to be accomplished? → User
- Physical Considerations: How shall we accomplish these things? → Analyst
«This is no longer true with Data Science? Or is it simply pusing the Man-Machine Boundary further?»
- Logical Considerations: What needs to be accomplished? → User
- Structured Tools for Analysis
- Data Flow Diagram (Part 2, Chapters 4-10)
- Data Dictionary Conventions (Part 3, Chapters 11-14)
- Structured English, Decision Tables, and Decision Trees (Part 4 Chapters 15-17)
- Data Flow Diagram (Part 2, Chapters 4-10)
1.1.1.4. What is Structured Analysis?
- New Goals for Analysis
- The products of the analysis must be highly maintainable, particularly the Target Document
- Problems of size must be dealt with using an effective method of partitioning
- Graphics have to be used wherever possible
- We have to differentiate between logical and physical considerations, and allocate responsibility between the analyst and the user
- The products of the analysis must be highly maintainable, particularly the Target Document
1.1.2. Conduct of the analysis phase
1.1.2.1. The classical project life cycle

1.1.2.2. The modern project life cycle
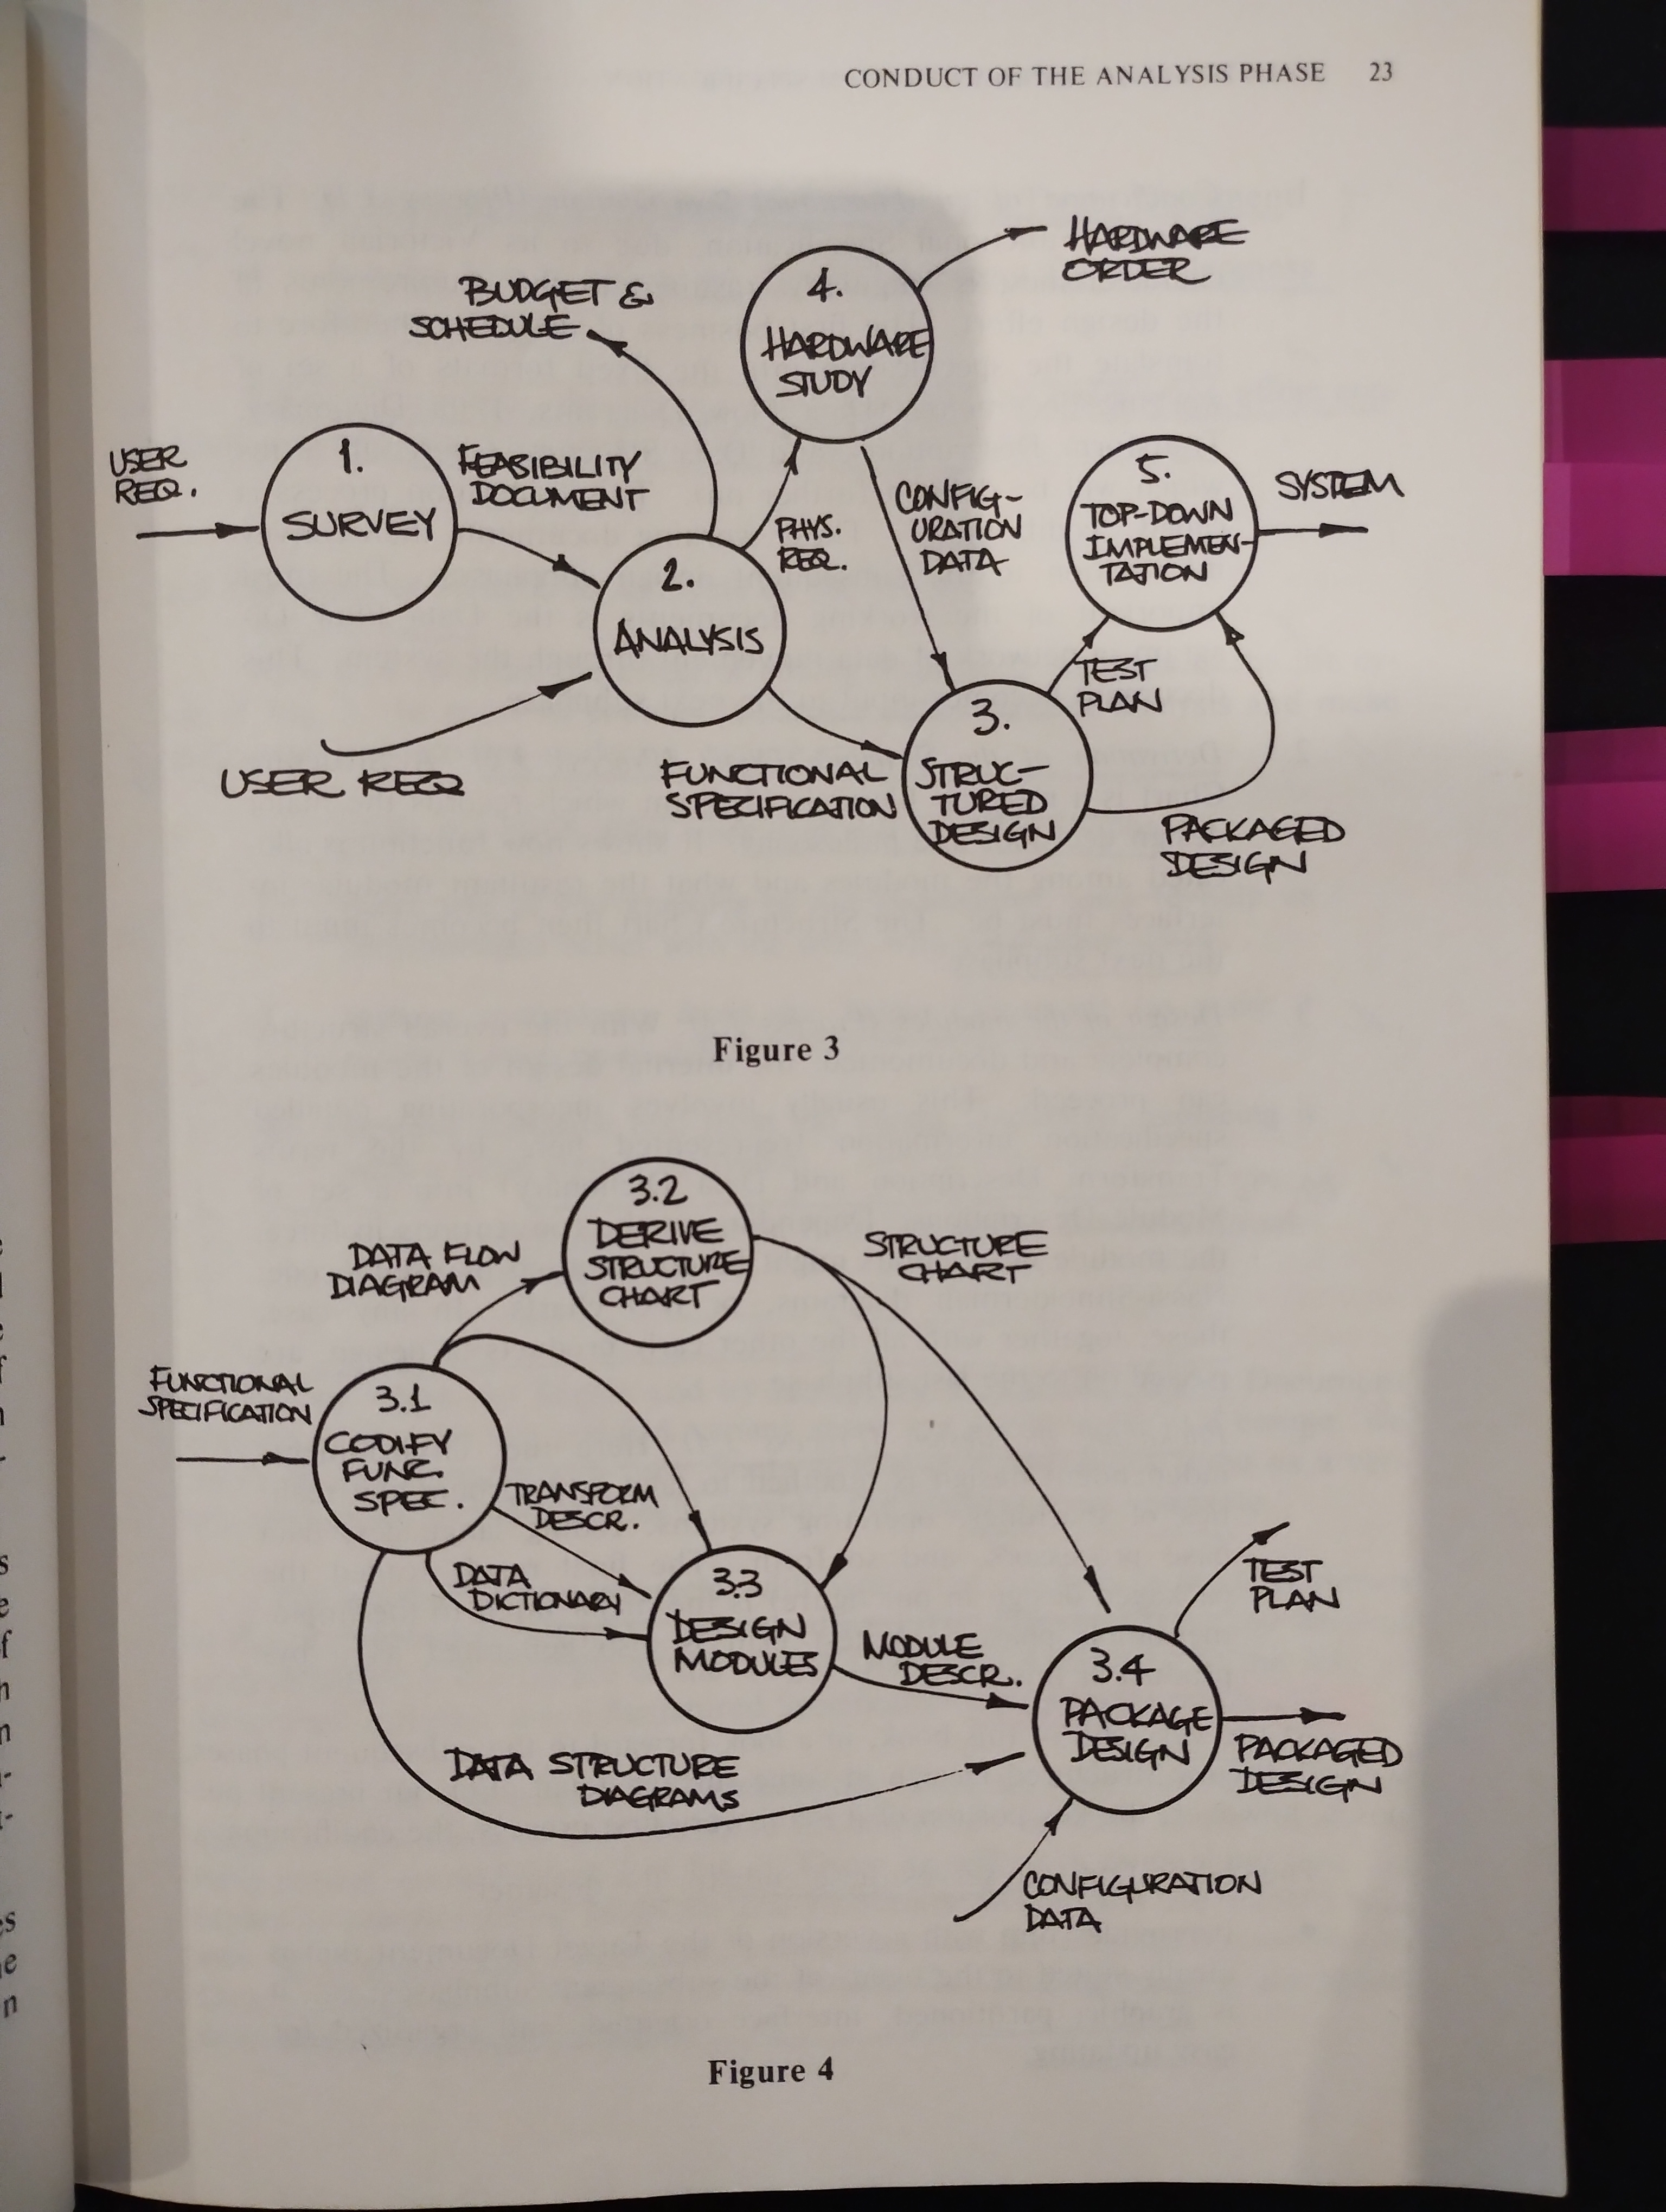
- Codification of the Functional Specification (Process 3.1)
Translate the spec into the fixed formats of a set of working documents (Data Flow Diagram’s, Data Dictionary, Transform Description’s and Data Structure Chart )
This translation is called “codification”
Data Flow Diagram becomes input to the next subphase
- Derivation of the Structure Chart (Process 3.2)
Is a modular hierarchy diagram with records the major design decisions and philosophy
How function is allocated among the modules and what the resultant modular interfaces must be
It becomes input to the next subphase
- Design of the modules (Process 3.3)
Incorporating detailed spec information (Transform Description and Data Dictionary) into a set of Module Descriptions
Transform Description: statement describing the logical policy that governs transformation of input data flow(s) into output data flow(s) at a given functional primitive
Module Descriptions might be documented by pseudocode, Nassi-Shneiderman diagrams, or IPO (Input/Processing/Output) charts
These, together with all the other early products of design, are passed on to the next subphase
- Packaging the design (Process 3.4)
Here the environment-independent design is modified to take into account the realities of machines.
The final result (called the packaged design) is the major input to the implementation phases
A test plan is also generated as a by-product of this work
- The codification step serves these ends for the designer
- It provides him with a version of the Target Document that is ideally suited to the needs of subsequent phases: graphic, partitioned, oriented, and organized for easy updating
- It hels him to understand and ealuate the Target Document
- It helps him to check the Target Document for completeness and coherency
Taken all together, the various components of the codification effort constitute a one-to-one replacement of the Target Document
- It provides him with a version of the Target Document that is ideally suited to the needs of subsequent phases: graphic, partitioned, oriented, and organized for easy updating
1.1.2.3. The effect of Structured Analysis on the life cycle
- Move the codification work back into the analysis phase
- Make use of the graphics of our codification tools to help us communicate better with the user, which will allow us to…
- Remove redundancy from the Target Document (to make it easier to keep up-to-date)
- Remove narrative text from the Target Document, replacing it with a more formal equivalent
- Remove physical information from the Target Document, making it totally logical
Structured Specification instead of Functional Specification
1.1.2.4. Procedures of Structured Analysis
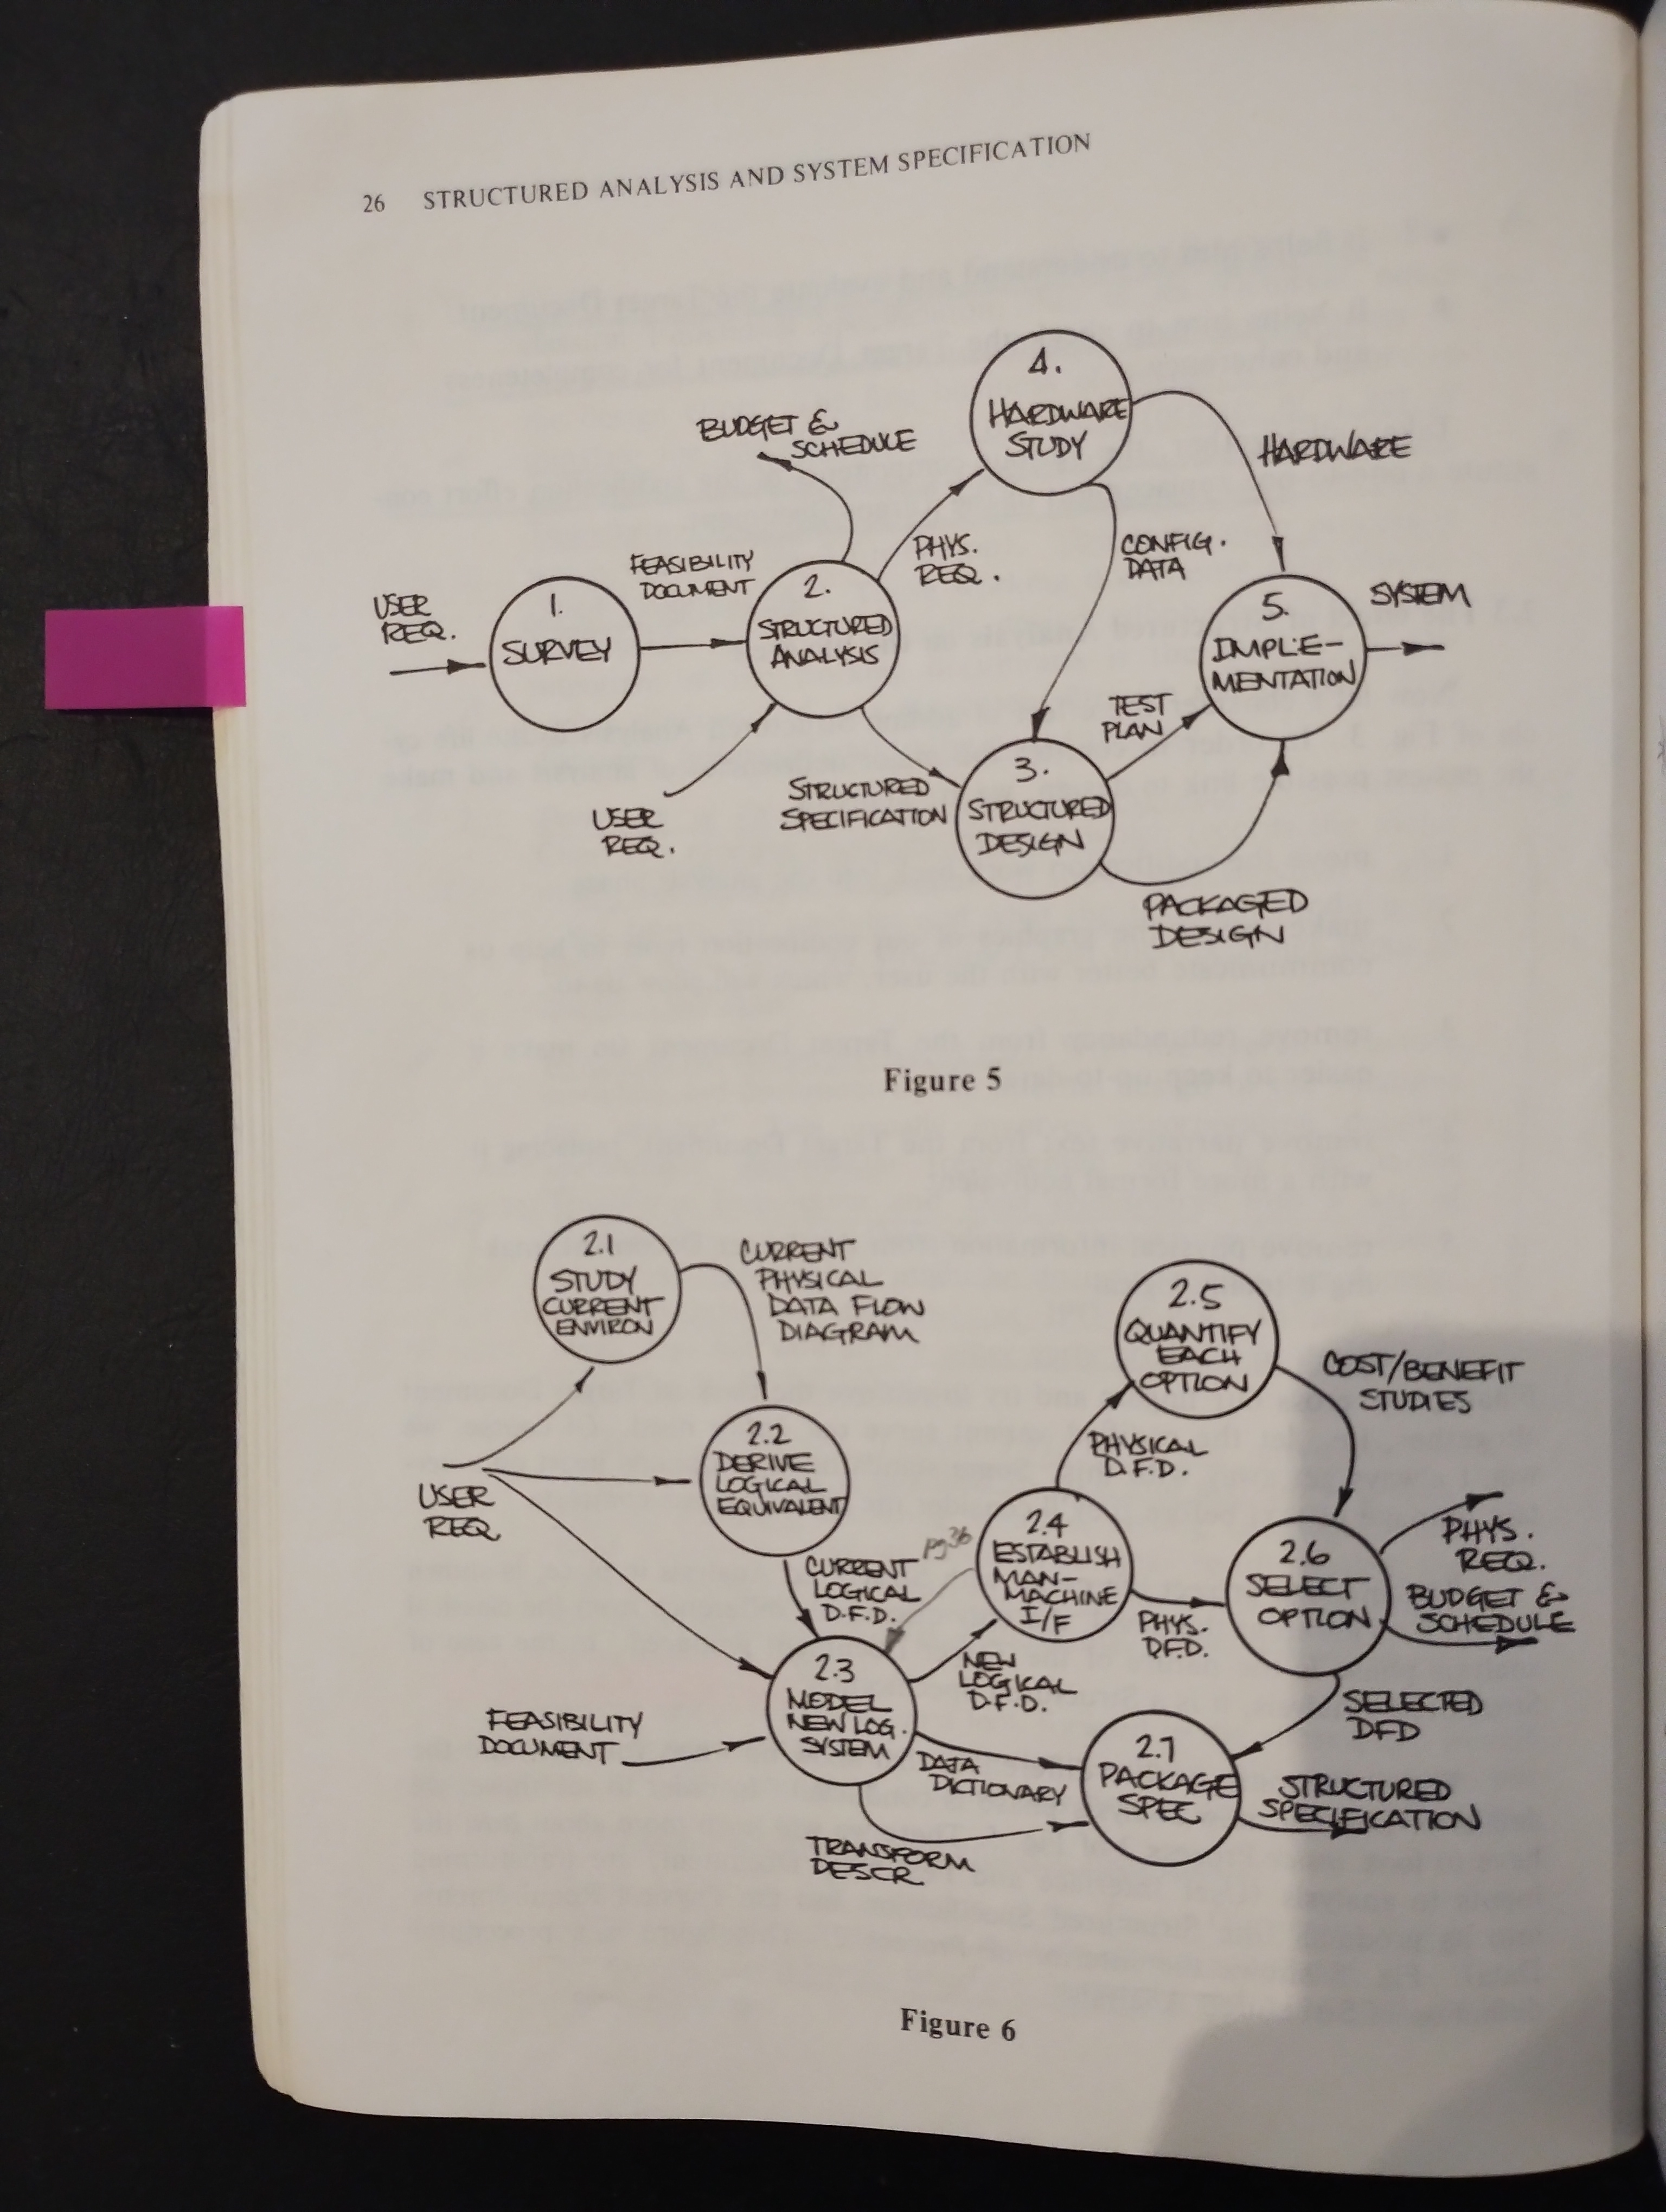
- Study of the current physical environment → Current Physical Data Flow Diagram
- Derivation of the logical equivalent of the current environment → Current Logical Data Flow Diagram
- Derivation of the new logical environment → New Logical Data Flow Diagram
- Determination of certain physical characteristics of the new environment → set of tentative New Physical Data Flow Diagram
- Quantification of cost and schedule data associated with each of the possibilities represented by the set of New Physical Data Flow Diagram
- Selection of one option → One selected New Physical Data Flow Diagram
- Packaging of the New Physical Data Flow Diagram and supporting documents into the Structured Specification
- Study of the Current Environment
Is a complete study of affected user areas
Before this proces can begin, you must make an early guess at the scope of the project: who the users are, how muchu of their work may be subject to change if the new system is introduced
Aside from this, the study of the current environment ought to proceed without much awareness of the impending change
Working closely with the users, you learn and document the way things currently work. Rather than do this from the point of view of any one user of set of users, you attempt to assess operations from the viewpoint of the data
A Data Flow Diagram is actually a portrayal of a situation from the data’s point of view.
You are attemtping to build a verifiable model otf the current environment. In order to make it verifiable, you have to make it reflect his concept of current operations. So you use his terms, and in some cases, his partitioning: your DFD will be full of department and individual names, form numbers, and the like
They help him to correlate between the paper model you are building and the business area it represents
→ Current Physical Data Flow Diagram
This study is considered done when we have a complete Current Physical Data Flow Diagram describing the area, and the user has accepted it as an accurate representation of his current mode of operation
- Determination of the context to be studied
- Identification of users affected (remember to look for all three levels of user)
- User interviews
- DFD
- Collection of sample data types, files, and forms to complement the DFD
- Walkthroughs with the user to verify correctness
- Publication of the resulting documentation
- Determination of the context to be studied
- Deriving Logical Equivalents
“Logicalize” our model of the current environment. This is largely a cleanup task, during which we remove the physical checkpoints items, replacing each one with ist logical equivalent.
A particular implementation of policy is replaced by a representation of the policy itself.
The underlying objectives of the current operation are divorced from the methods of carrying out those objectives
- Modelling the New Logical System
How much shall we automate? This involves selecting the man-machine boundary
The New Physical Data Flow Diagram it is of course very physical; we have only deetermined the scope of our automated system
Good analysis practice calls for producing a menu of workable alternatives at this point. We produce a number of differently marked up Data Flow Diagram’s showing various degrees of automated function
- Quantifying Options
In Process 2.5, we look at each of the tentative New Physical Data Flow Diagram’s produced by the previous process, and try to quantify associated costs and benefits.
Note that we do nos select hardware here. We only select a genre of hardware for each option
It is important that hardware selection be allowed to waint until the beggining statges of design have gotten underway, because only then will we have all the necessary selection criteria estabished
- risk
- financial terms (lease vs. purchase vs. rental)
- maintenance requirements
- operating costs
- training costs
- data conversion costs
- personnel considerations
- prestige, public image, and pizzazz (energy, excitement)
- risk
- Packaging the Specification
It seems to be more of a political process than a technical one
1.1.2.5. Characteristics of the Structured Specification
- Data Flow Diagram’s, showing the major decomposition of function, and all the interfaces among the pieces
- Data Dictionary, documenting each of the interface flows and data stores on any of the Data Flow Diagram’s
- Transform Description’s, documenting the internals of the DFD processes in a rigurous fashion (Structured English, Decision Tables, Decision Trees)
The Structured Specification should be:
- Graphic. DFD should present a meaningful, conceptually easy-to-understand presentation/picture of the subject matter
- Partitioned. The proceess on the DFD are the basic elements into which the system is decomposed in a top-down fashion
- Rigorous. Data Dictionary: rigourous documentation of the interfaces; Transform Document: rigourous specification of the process
- Maintainable. Redundancy is minimized. The process of changing the Structured Specification can be tightly controlled
- Iterative. Portions of the Structured Specification can be dealt with separately
- Logical, not physical
- Precise, concise, and highly readable
1.1.2.6. Political effects of Structured Specification
- Try it first on a small, non-critical pilot project
- Try it with people who are favorably disposed to the idea; don’t cram it down anybody’s throat
- Document the effects in a conscise and not overly religious manner (Getting carried away may create a backslash)
- Build expertise before trying to implement it on a global basis
- Effect on the Project Life Cycle
The project life cycle is front-end loaded. The analysis phase takes up a large percentage of total project manpower. There are three reasons:
- Structured Analysis calls for a rigorous study of the user area, a study which was frequently skipped in the classical approach
- Structured Analysis causes the analyst to do more than specify; he must also partition what he is specifying
- Structured Analysis results in moving certain task that used to be done much later in the project life cycle up into the analysis phase. As we will see, one of these tasks is documentation of user procedures, something that used to be postponed intil after system delivery
The justification for additional manpower in analysis is that less manpower will be required later on
Management is suspicious of all time spent prior to writing hard code, that the project team really uses all the precoding phases to rest up before getting into the real work of building the system
In order to justify front-loading time, you have to come down har on the high costs of poor analysis:
- Projects that never get finished
- Projects that never get started because of lack of agreement on what to do
- Projects that deliver unusable products
- Structured Analysis calls for a rigorous study of the user area, a study which was frequently skipped in the classical approach
- Effect on the User-Analyst Relationship
- Users are not dummies. Some of the methods they work with are far more complicated than Structured Analysis
- Users are inclined to have little patience with jargon. If you speak jargon, they are liable to decide that they have no business looking at it since they are not experts in such things instead of examine things constructively and help you to get it right
- Users need have only a reading knowledge of Structured Analysis. There is no need for them to learn how to write Structured Specifications
- Users are not dummies. Some of the methods they work with are far more complicated than Structured Analysis
- Partitioning of Effort
It provides an effective way of partitioning manpower during the analysis phase
1.1.2.7. Questions and Answers
- You ought to allow about 30% of the total analysis phase manpower for this task
- The work (analysis) has to be done eventually. The choice really boils down to doing it upfront where it can ebe a positive aid to future work, or going ahead with an incomplete understanding of the user area and then fixing things up during accepcance testing.
You build legitimacy with the user. No user is going to be able to accord you any credibility on a new way to do his job if he doesn’t think you understand the old way. - Management, in a desperate urge to “get on with the real work”, is all to ready to skip the thorough study of the user area on any available pretext. You have to be very hard-nosed about this.
- What if the physical parameters have been established before the project begins?
The whole project direction is modified by such and approach. The best way to deal with such a situation is to ignore it until you have completed your study of the user area - You have shown the analysis phase proceeding in a linear phasion; isn’t there feedback among the various subphases?
Yes absolutely. There is a particularly important possibility of feedback bewtween Process 2.3 and Process 2.4 in Fig. 6. Going back to the logical dataflowing to incorporate features that are purely dependent upon the physical option selected.
1.1.3. The Tools of Structured Analysis
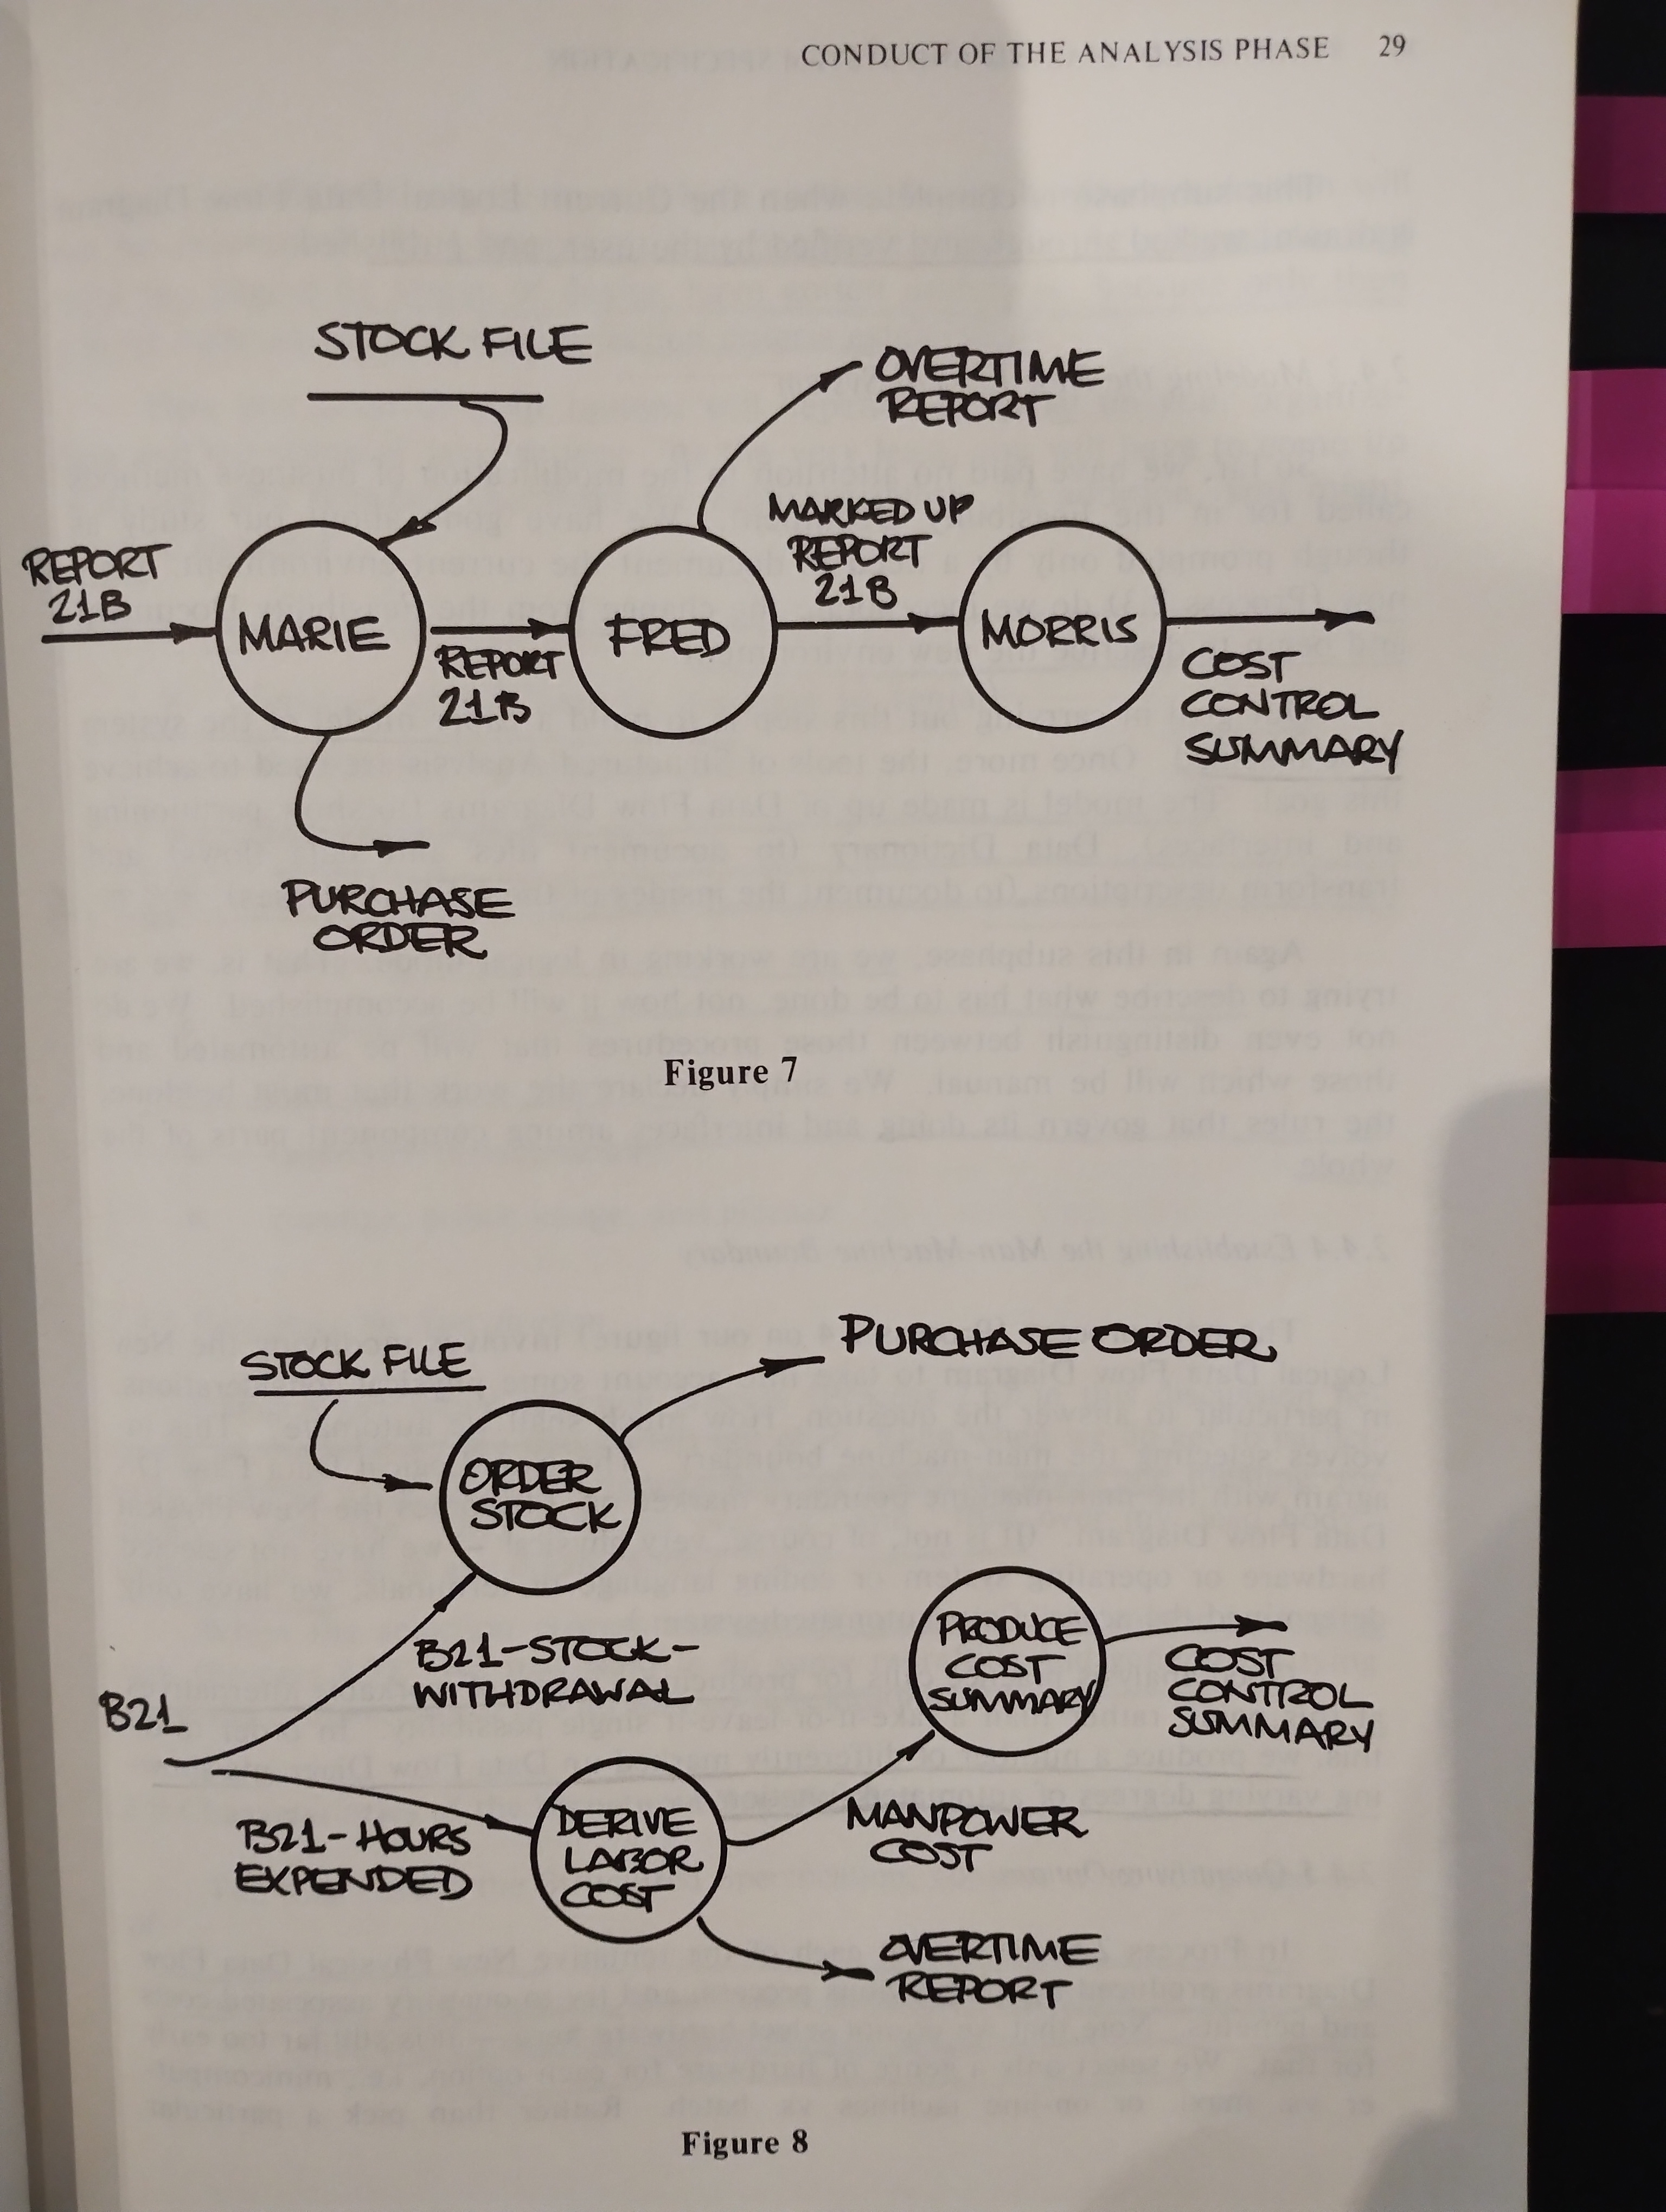
1.1.3.1. A sample situation
1.1.3.2. A Data Flow Diagram example
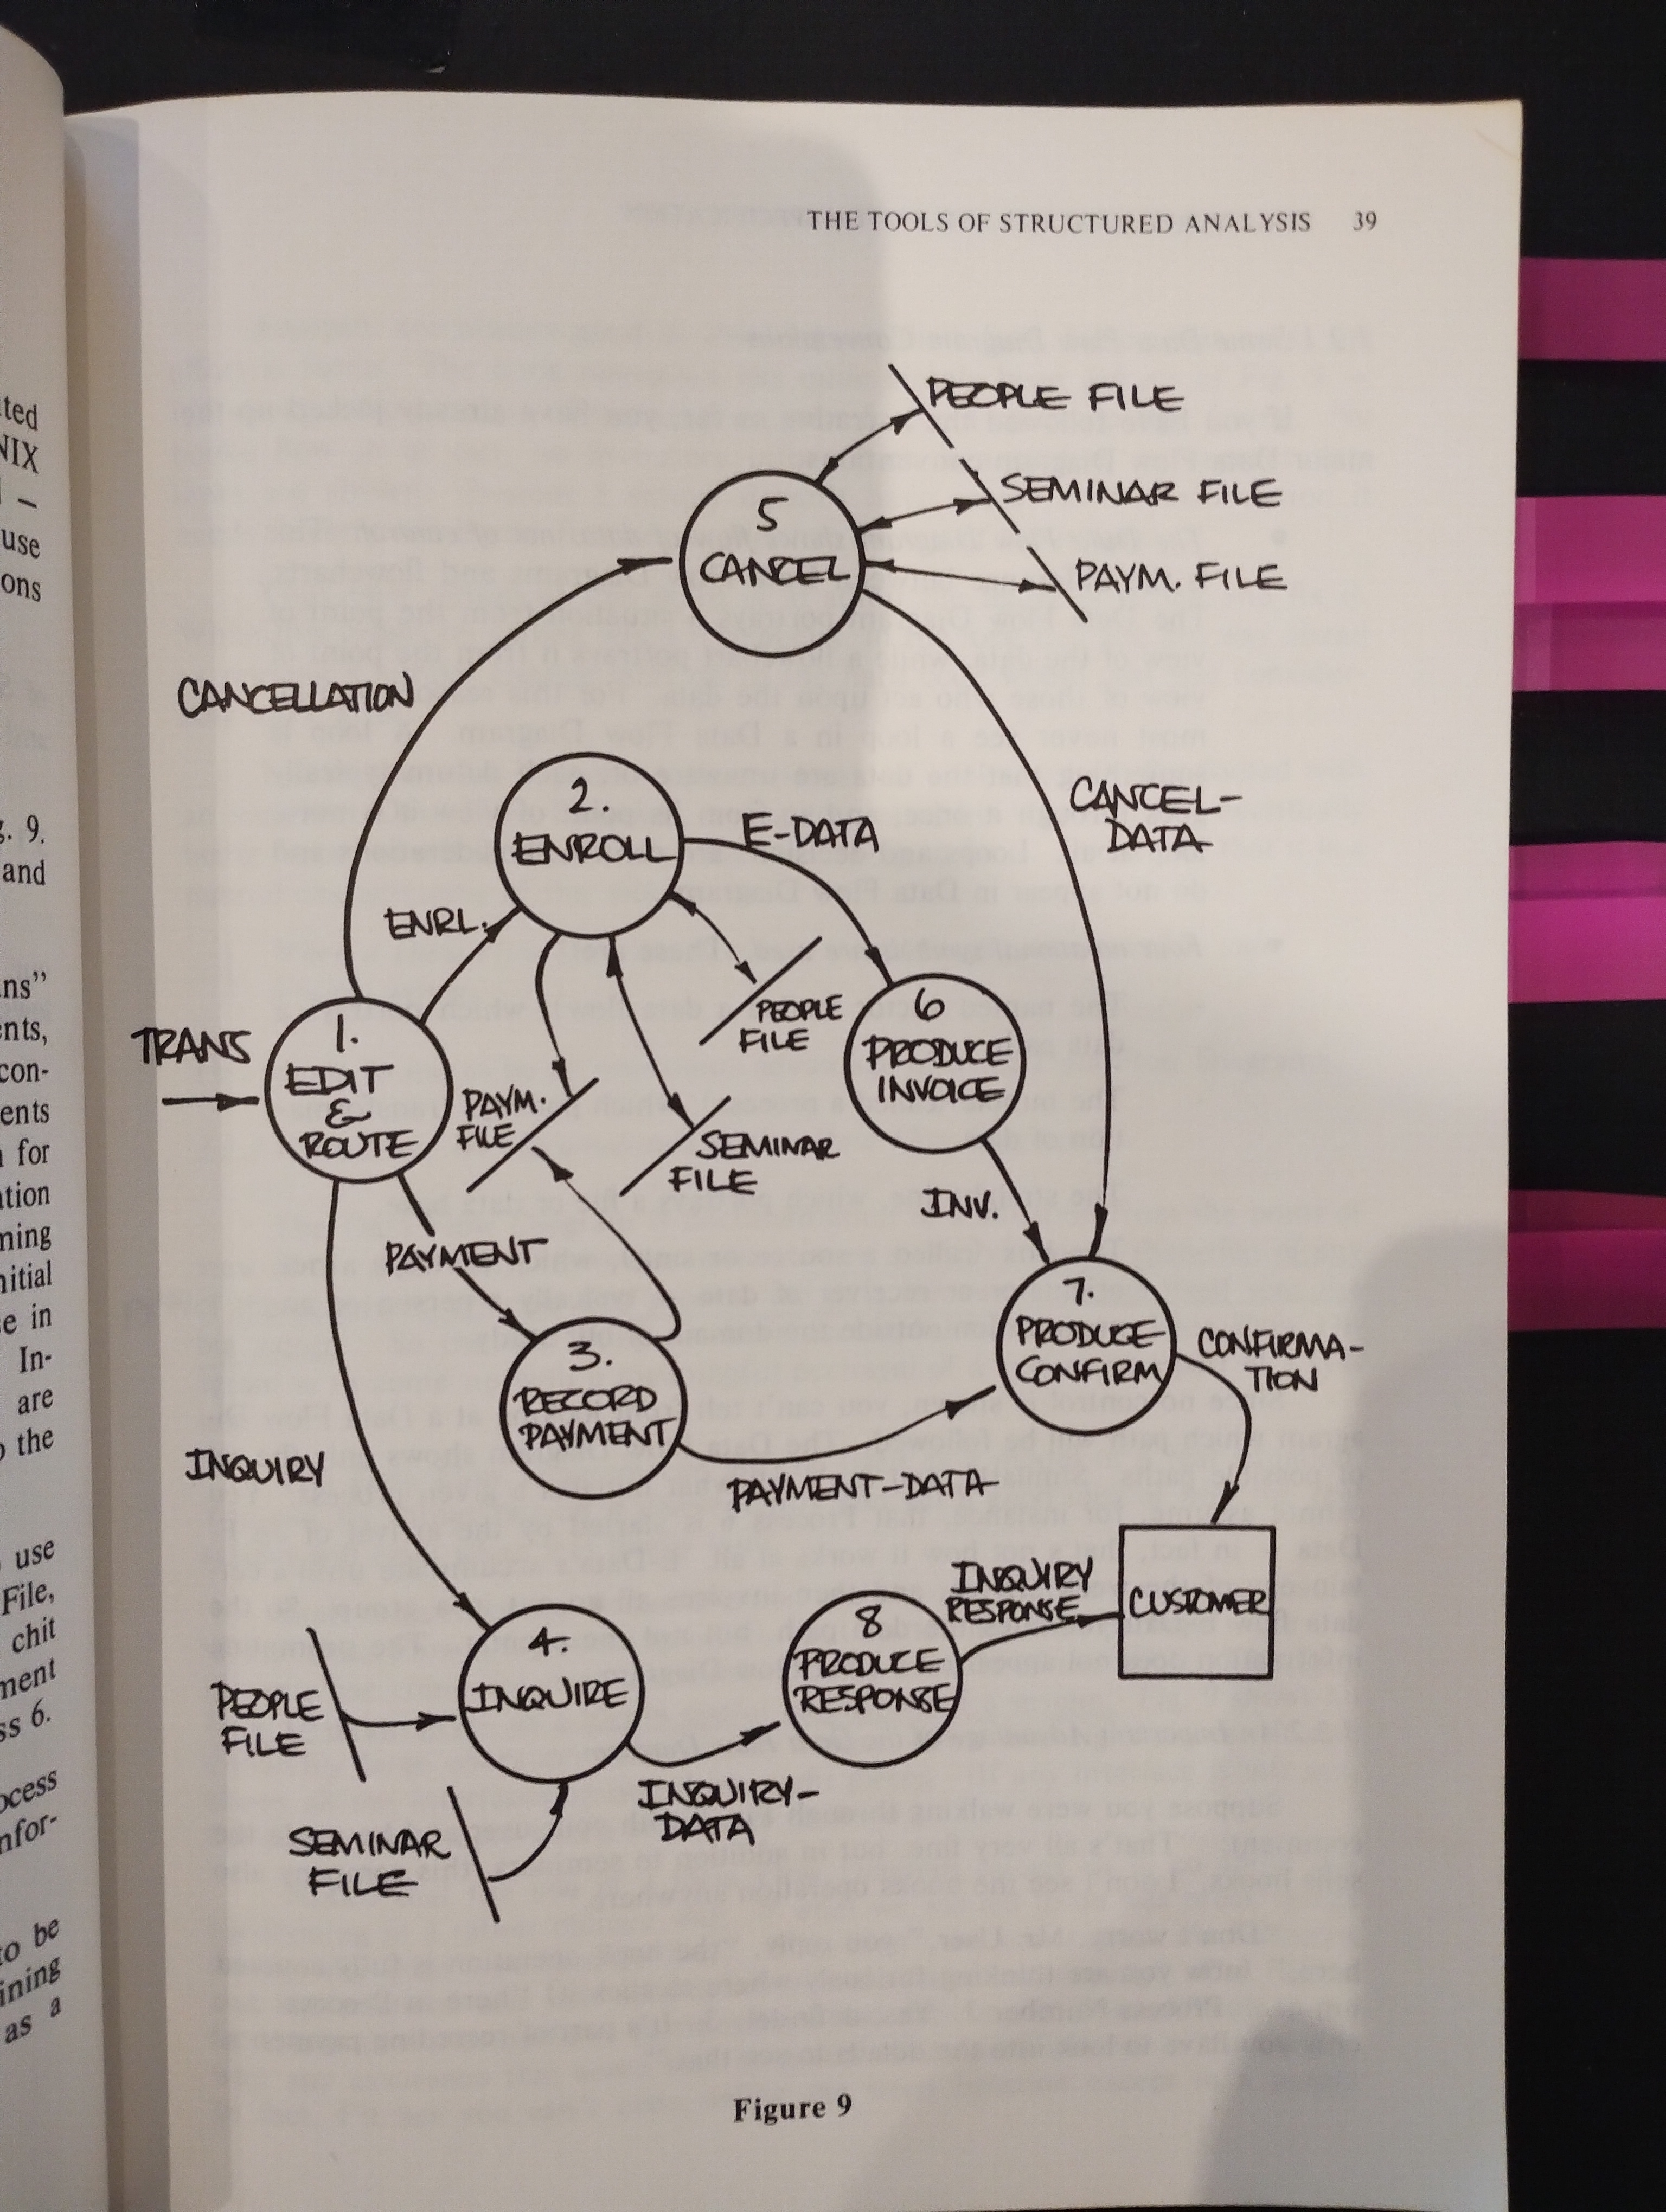
- When a Data Flow Diagram is wrong, it is glarinly, demonstrably, indefenibly wrong
- The DFD is documentation from the point of view of data. This turns out to be a more useful viewpoint than that of any of the people or systsms that process the data, because the data itself sees the big picture
- DFD gives us a highly useful partitioning of a system
- A partitioning may be considered functional when the interfaces among the pieces are minimized
1.1.3.3. A Data Dictionary example
1.1.3.4. A Structured English example
You can’t specify by partitioning alone. At some point you have to stop breaking things down into finer and finer pieces, and actually document the makeup of the pieces
1.1.3.6. A Decision Tree example
1.2. Part 2: Functional Decomposition
1.2.1. Data Flow Diagram DFD
1.2.1.1. What is a Data Flow Diagram?
1.2.1.2. A Data Flow Diagram by any other name
1.2.1.3. DFD characteristics - inversion of viewpoint
1.2.2. Data Flow Diagram Conventions
1.2.2.1. Data Flow Diagram elements
1.2.2.2. Procedural annotation of DFD’s
1.2.2.3. The Lump Law
1.2.3. Guidelines for drawing Data Flow Diagrams
- Identify all net input and output data flows. Draw them in around the outside of your diagram
- Work your way from inputs to outputs, backwards from outputs to inputs, or from the middle out
- Label all the interface data flows carefully
- Label the bubbles interms of their inputs and outputs
- Ignore initialization and termination
- Omit details of trivial error paths (for now)
- Do not show flows of control or control information
- Be prepared to start over
1.2.3.1. Identifying net inputs and outputs
Determining net inputs an doutputs is colsely tied to the decision on what the context of the study shall be
Selecting the context is a matter of judgement and feel
Select a context that is large enought to include everything relevant to the development effort, but small enough to include little or nothing that is irrelevant
Everything left outside is going to be ignored forever after, you sohould err on the conservative side by including too much «Maybe only in complicated systems, complex systems need iterating on selecting different boundaries»
Having decided on a boundary, you must not look for data flows that cross it. These are the net inputs and outputs
1.2.3.2. Filling in the DFD body
To document the current user area, you are not called upon to describe how things ought to be but rather how they are
Concentrate first on the data flows. Look for the major pipelines of data moving about the operations
A significant set of information that the user treats as a units is certain to end up as a data flow
Look inside the blank processes: can you imagine any internal data flows that might be userd within the process? Check with the user if they do indeed exist
For each data flow, ask the question: What do I need in order to build this item?
- Where do these compoments come from?
- Can any of the incoming data flows be transformed into any of these?
- What intervening processes will be required to effect the transformation?
Enter files on your DFD to represent the various data repositories taht the user tells you abount. Make sure you know the contents of each file in enought detail that you can figure out flow into and out of it
Be prepared to go back and modify the context boundary. You may have forgotten and input that is required as a key compoment of one of your data flows: add it in. You may have an incoming data flow that vanishes – is of no use to anything inside the context; take it out. You might even have a situation like Fig. 26 where your context includes not one but two disconnected networks, one of which is completlty separtated from the true domain of your interest → you can safely eliminate the entire extra network
1.2.3.3. Labeling data flows
- Be sure to give a name to each and every data flow. The ones you tend to leave unnamed are invariably the ones that are unnameable (because the partitioning was poor)
- Make sure the name is honest. It has to apply to the whole data flow, not just to its major component
- Avoid whishy-washy names like “data” and “information”
- Be careful not to group disparate items together into one data flow when they have no business being treated as a whole
1.2.3.4. Labeling processes
Every data flow on your DFD should be named
Concentrating first on the data flows and last on the processes is a an intrinsically top-down approach, and concentrating first of all on the processes is intrinsically bottom-up
- Make sure your names are honest
- Try for names that consist of a single strong action berb and a singular object. If you have two verbs, perphaps you should partition further
- Beware of wishy-washy words. The worst offenders are words like “process” and “handle”. You may have an unnameable process
- Repartition to avoid unnameable processes. Break them into or group them in order to come up with something you can name easily
1.2.3.5. Documenting the steady state
Assume that the system described by your DFD is up and running. Don’t worry for the moment about how it gets started or how it closes down
1.2.3.6. Omiting trivial error-handling details
Defer thinking about the details of trivial error paths
Get the big picture worked out before looking at any of the odds and ends
Error processing usually does no t have a strong effect on the philosophy of a system (High-reliability applications are an exception)
Most systems derive their philosophy from the main-line processing. Internal structure must reflect this philosophy. That is the best understood component of the system and threrfore something that should be allowed to shape the thinking of implementation and maintenance personnel
If the error requires no undoing of past processing, ignore it for the moment; if it requires you to back out previous updates or revert a file or files to a previous state, then do not ignore
1.2.3.7. Portraying data flow and not control flow
Ask yourself what information flows over the pipeline; if there is none, it is likely to be documenting the stream of consciousness of the data processor, rather than the estream of the data iteslf. Hence it is control flow. Remove it.
1.2.3.8. Starting over
The human mind is an iterative procesor. It never does anything exactly right the first time. It is particularly good at taking an imperfect implementation of a given task, and making significant improvements to it. This can do over and over again, coming up with better results each time.
Be prepared to abandon your early DFD’s by replacing them with improved versions
Starting from scratch is a small price to pay for a significantly better resultYou ought to be able to point to several generations of improvements
1.2.4. Leveled Data Flow Diagrams
1.2.4.1. Top-down analysis - the concept of leveling
1.2.4.2. Elements of a leveled DFD set
1.2.4.3. Leveling conventions
1.2.4.4. Bottom-level considerations
1.2.4.5. Advantages of leveled Data Flow Diagrams
1.2.4.6. Answers to the leveled DFD Guessing Game
1.2.5. A Case Study in Structured Analysis
1.2.5.1. Background for the project
1.2.5.2. Welcome to the project - context of analysis
1.2.5.3. The top level
1.2.5.4. Intermezzo: What’s going on here?
1.2.5.5. The lower levels
1.2.5.6. Summary
1.2.5.7. Postscript
1.2.6. Evaluation and Refinement of Data Flow Diagrams
- Tests for correctness, sure signs that a DFD is wrong, that we have misunderstood the user or failed to translate its descriptions of operations into a structured format properly
- Tests for usefulness, indications that a DFD, although it might be technicalyy correct, is over-complicated and difficult to understand, that it doest not live up to our requirement of a conceptually easy-to-deal-with description
- Approaches to starting over, mechanical methods for coming up with an improved version
1.2.6.1. Tests for correctness
The value of an early wersion, no matter what its failings. If your wait for a complete and perfect concept to germintate in your mind, you are likely to wait forever.
Perfect ideas do not germinate, they evolve
Put your lousy idea down on paper, rout out its faluts one by one, and gradually come up with a good product
Engineering is careful improvement of a faulted concept into a desired result
- It might have missing data flows, information required by a process but not available to it
- It might have extraneous data flows, informations that is of no value to any of the processes and thus needlessly complcated the interfaces
- It might have missing processes
- It might be incorrectly leveled
- It might be deceptively labeled
- It might contain inadvertent control flow of flow or control information
- It might be conceptually incorrect. This is going to be the thoughtest kind of error to uncover, the kind wwhere a DFD is demonstrably workable and interally consistent but just doesn’t reflect reality
- DFD Bookkeeping
- Unnameable data flow
A data flow is unnameable for one and only one reason: because you haven’t got the foggiest idea of what information it carries
This is often the result of concentrating first on the “functions”, rather than on the pipelines of data: it does not partition in any meaningful sense.
- Control flows (Pseudo-data flows)
You know it is control as soon as you try to define its composition. It has no composition. It consists only of a pulse
- Naming conventions (Deceptive naming)
- Does the name make sense in terms of the input and output data flows associated with the bubble?
- Does the name accurately reflect everything going on in the bubble as indicated by the names given to its child bubbles?
- Avoid names that deceive the reader by concealing much or all of the work allocated to a bubble
- Does the name make sense in terms of the input and output data flows associated with the bubble?
- Summary
- Make sure every data flow has a name
- Make sure you can define every name
- Eliminate “data flows” with null composition
- Test bubble names against inputs and outputs
- Make sure every data flow has a name
- Unnameable data flow
- Consistency Errors
DFD can be self-contradictory or have holes or redundant processes. Usually, you will run across such problems as you work your way down to the bottom levels.
When you add a new data flow at level n, go back up to the parent to not miss a change that has to be made in another area
Be particularly careful of your description of work that falls on or near the boundary between two different users’ areas of responsibility. Frequently both users consider the boundary process to be part of their areas → duplication
Resolve it by putting the single process in either one placce or the other
The opposite situation can also occur: a boundary process that neither user remembers to tell you about. Usually that will be signalled by an output data flow from one area not being exactly equivalent to the input you expected on the other
- Data Conservation
Data conservation error: A process must be able to build its outputs using only the information in data flows explicitly shown flowing into in, plus constant information. Otherwise it has a data conservation error
Opposite situation in which a data flow or some component dies inside a process. This is not a guaranteed error, but you have to be suspicious of it: what’s the use of it?
Later in analysis, when we are describing the new system rather than the current environment, dead-end data flows will be considered tru errors. Remove all useless data flows to simplify the interface
- File Problems
Unused file: The user doesn’t keep the file around for no purpose whatsoever. When you ask him what he uses the file for, you will almost certainly unconver some function that you had not previously suspected
The data flow connecting a buble to a file must thow the net direction of flow
The double arrow would only be used if the process updated the file and used information from it for some other purpose
- Conceptual Errors - The Analysis Phase Walkthroughs
The only way to get rid of conceptual errors is to work closely with the user and his staff, testing out the DFD’s for accuracy in their representation of business operations (the walkthrough)
The uestion considered in the analysis phase walkthrough are of more critical importance to the project success than the ones from the implementation phases
The user is present, so the policital climate is more complicated
- The first few walkthroughs should be on the users’ own turf. They ought to last no more than ten minutes each. The users ought not to be aware that they have participated in a walkthrough
- Do nos send out DFD’s to users in advance unless they are already familiar with the methods in use. The users’ introduction to new methodology ought to be under yout strict control
- Show new users the middle- and lower-level diagrams first. Hold back the concept of leveling until they have become familiar with the basic ideas
- Complement your walkthrough of the DFD with additional physical information (people, places, document names, and so forth) to help the user follow along
- As the Data Flow Diagram’s become more presentable, and the users more familiar with them, hold formal walkthroughts. Use an overhead projector, if possible
- While you walk through a level n DFD, members of the walkthrough team should have level n-1 in their hands. This helps them keep track of the context of your discussion
- In all dealings with the user, avoid the user of jargon specific to your methods. A DFD is a picture. A Data Dictionary is a list of interface and document descriptions. Structured English is English.
- The first few walkthroughs should be on the users’ own turf. They ought to last no more than ten minutes each. The users ought not to be aware that they have participated in a walkthrough
1.2.6.2. Tests for usefulness
Sometimes you come up with a DFD that is technically correct, but hard to read and to comprehend (not useful)
- Interface complexity
- Process names
- Evenness of partitioning
- Interface Complexity
The number and clarity of data flows into and out of a given bubble affects its usefulness → Less is better
Look first at the most complicated bubble (most interfaces, most variation in type of interfaces) and start your improvement here
How could that bubble be changed to cut down on interface complexity? What portion of its work could be spun off and allocated to another bubble in such a way as to reduce passed information? Perhaps the whole process should be split into two or three pieces, or amalgamated into some other bubble. Anything you can do to dercrease complexity of interfaces at a given level is an improvement
- Process Names
Strong action verbs, coupled with a single explicit object usually are functional primitives with a single input and a single output
Weak process names are signs of poor partitioning. When you detect them, try to repartition to cume up with more nameable sets of work. Don’t waste your time trying to think up a good name for a bubble that realy can only be called Handle Input or some such think - gt rid of it
The ideal name is one that consists of a single strong verb with a single concrete object. But you will only be able to come up with such names near or at the bottom of your wierarchy (where you shold insist on it)
Strong names are sign that you have reached the bottom
- Uneven Partitioning
Avoid the extremes of unevenness. If one of your bubbles on a given level is primitive, and another needs to be partitioned down three or four more levels, you have not achieved a useful partitioning: you have just “chipped” of an insignificant piece and left the rest. Readability will suffer becaue the diagram will combine some details and some higher levels of abstraction. Go back and try again.
1.2.6.3. Starting over
Topological Repartitioning
For example: Independent flows of data inside a level can be split on its parent level
1.2.7. Data Flow Diagrams for System Specification
1.2.7.1. The man-mahcine dialogue
1.2.7.2. The integrated top-level approach
1.2.7.3. Problems and potential problems
1.3. Part 3: Data Dictionary
1.3.1. The analysis phase Data Dictionary
1.3.1.1. The uses of Data Dictionary
1.3.1.2. Correlating Data Dictionary to the DFD’s
1.3.1.3. Implementation considerations
1.3.2. Definitions in the Data Dictionary
1.3.2.1. Characteristics of a definition
1.3.2.2. Definition conventions
1.3.2.3. Redundancy in DD definitions
1.3.2.4. Self-defining terms
1.3.2.5. Treatment of aliases
1.3.2.6. What’s in a name?
1.3.2.7. Sample entries by class
1.3.3. Logical Data Structures
1.3.3.1. Data base considerations
1.3.3.2. Data Structure Diagrams (DSD’s)
1.3.3.3. Uses of the Data Sructure Diagram
1.3.4. Data Dictionary Implementation
1.3.4.1. Automated Data Dictionary
1.3.4.2. Manual Data Dictionary
1.3.4.3. Hybrid Data Dictionary
1.3.4.4. Librarian’s role in Data Dictionary
1.3.4.5. Questions about Data Dictionary
1.4. Part 4: Process Specification
1.4.1. Description of Primitives
1.4.1.1. Specifications goals
1.4.1.2. Classical specification writing methods
1.4.1.3. Alternative means of specification
1.4.2. Structured English
1.4.2.1. Definicion of Structured English
1.4.2.2. An example
1.4.2.3. The logical constructs of Structured English
1.4.2.4. The vocabulary of Structured English
1.4.2.5. Structured English styles
1.4.2.6. The balance sheet on Structured English
1.4.2.7. Gaining user acceptance
1.4.3. Alternatives for Process Specification
1.4.3.1. Whan to use a Decision Table
1.4.3.2. Getting started
1.4.3.3. Deriving the condition matrix
1.4.3.4. Combining Decision Tables and Structured English
1.4.3.5. Selling Decision Tables to the user
1.4.3.6. Decision Trees
1.4.3.7. A procedural note
1.4.3.8. Questions and answers
1.5. Part 5: System Modeling
1.5.1. Use of Systems Models
1.5.1.1. Logical and physical DFD characteristics
1.5.1.2. Charter for Change
1.5.1.3. Deriving the Target Document
1.5.2. Buildging a Logical Model of the Current System
1.5.2.1. Use of expanded Data Flow Diagrams
1.5.2.2. Deriving logical file equivalents
1.5.2.3. Brute-force logical replacement
1.5.2.4. Logical DFD walkthroughts
1.5.3. Buildging a Logical Model of the Future System
1.5.3.1. The Domain of Change
1.5.3.2. Partioning the Domain of Change
1.5.3.3. Testing the new logical specification
1.5.4. Physical Models
1.5.4.1. Establishing options
1.5.4.2. Adding configuration-dependent feature
1.5.4.3. Selecting an option
1.5.5. Packaging the Structured Specification
1.5.5.1. Filling in deferred details
1.5.5.2. Presentation of key interfaces
1.5.5.3. A guide to the Structured Specification
1.5.5.4. Supplementary an supporting material
1.6. Part 6: Structured Analysis for a Future System
1.6.1. Looking Ahead to the Later Project Phases
1.6.1.1. Analyst roles during design and implementation
1.6.1.2. Bridging the gap from analysisi to design
1.6.1.3. User roles during the later phases
1.6.2. Maintaining the Structured Specification
1.6.2.1. Goals for specification maintenance
1.6.2.2. The concept of the specification increment
1.6.2.3. Specification maintenance procedures
1.6.2.4. The myth of Change Control
1.6.3. Transition into the Design Phase
1.6.3.1. Goals for design
1.6.3.2. Structured Design
1.6.3.3. Implementing Structured Designs
1.6.4. Acceptance Testing
1.6.4.1. Derivation of normal path tests
1.6.4.2. Derivation of exception path tests
1.6.4.3. Transient state tests
1.6.4.4. Performance tests
1.6.4.5. Special test
1.6.4.6. Test packaging
1.6.5. Heuristics for Estimating
1.6.5.1. The empirically derived estimate
1.6.5.2. Empirical productivity data
1.6.5.3. Estimating rules
Some of your estimates are subject to empirical derivation, but others are not. What can you do if you have no early quantum indicator, or if there is no past performance to which you can compare it?
Most estimating failures are not merely failures to estimate accurately, but failures to estimate at all.
- Rule 1
- Estimating is different from regurgitating
our superiors are subtler in letting us what the “right answer” is.
If there is a right answer and everyone knows it, then you are not even being asked to estimate, but to regurgitate - Rule 2
- Estimating is different from negotiating
If you negotiate instead of estimate, you have started off on the wrong foot. You sin, however, is not nearly as serious as if you first estimate and then negotiate - Rule 3
- Estimations are not subject to bargaining
It is well to cultivate an air of stunned disbelief to greet any attempt at bargaining. You are obliged to tell whoever makes the counter offer that the estimate is not his. - Rule 4
- Estimating is different from dividing a fixed duration into component parts
- Rule 5
- A slip in one project phase implies a proportionate slip in all subsequent phases
Rules 1 thorugh 5 all deal with a failure to estimate due to the influence of a known “right anwser”. The very presence of such an answer inhibits the estimating process. - Rule 6
- If you want a meaningful estimate from someone, don’t dell him “the answer”
If you do, he will regurgitate, negotiate, or divide - Rule 6.5
- An estimate is a projection based on probabilistic assessment.
You are saying, at the very least, that the probability of finishing in that time is not zero.
Most people do not mean to imply anything more by their estimates thatn the existence of a non-zero probability. In the absence of any better definition, they understand an estimate to be the most potimistic imaginable result that is not demonstrably impossible. That kind of estimate is a disaster for planning purposes - Rule 7
- A useful planning estimate is a projection that is as likely to be too pessimistic as it is to be too optimistic
- Rule 8
- The ratio between the most optimistic estimate and a useful planning estimate is farily uniform for any individual
So it makes sense to calculate this factor (by comparing past estimates to past results) and to apply it for each individual who makes estimates for you.
For this approach to be helpful, you need to inhibit feedback to the estimator. Tell him you want his most optimistic estimate, and don’t complain when it’s wrong
By appointing someone responsible for an effort, you destroy his ability to estimate effectively. - Rule 9
- Estimate by committee. Solicit estimates from everyone who understands the development. Throw away the estimate of the person directly responsible for the effort. Average the others
1.7. User-Analyst relationship
1.8. Links to Category Theory
1.9. Borrow in Open Library
1.10. Backus–Naur form - Wikipedia
In computer science, Backus–Naur form or Backus normal form (BNF) is a metasyntax notation for context-free grammars, often used to describe the syntax of languages used in computing, such as computer programming languages, document formats, instruction sets and communication protocols
1.12. Linearization losses paralellization
Structured text and Structured charts forget about parallelization and sources/sinks
For example, the category Term can be modified to represent Yourdon structured charts by forgetting about sources and sinks, and equating parallel connections with sequences.
It can also be modified to represent Jackson structure texts by forgetting about all input and output events, and again equating parallel connections with sequences.
1.13. What’s missing today
- We don’t have as many constraints on hardware resources as before, so they aren’t as decisive as they once were
- Computers are faster so feedback is faster. We can build more things, faster, so that means Analysis and Design can be shortened and made more iterative
- Physical and hardware means “things that are difficult to change”. Today it can be selecting a cloud provider, or a particular technology or whatever, but the same distinction “Physical vs Logical” although “Physical” has a different meaning still holds
1.14. What does it bring to the table
- A focus on Linguistics and Philosophy that perphaps has been lost today to specialization